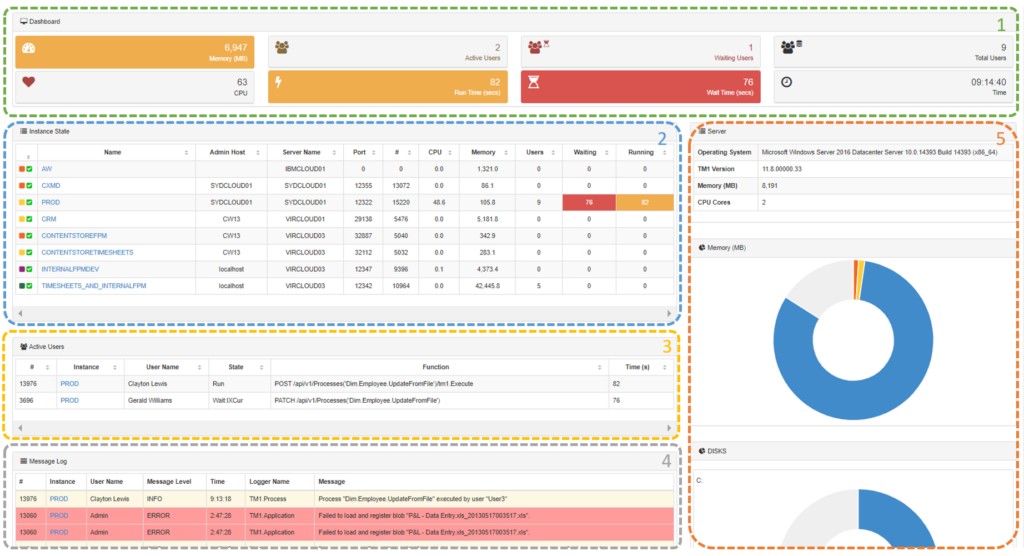
The dashboard gives you an overview of what’s happening on the server selected. It can be split into 5 sections:

Dashboard
At the top, you will see the dashboard panel with a set of KPI, it is a summary of all TM1 instances on the server selected in the top dropdown:

Instance State
Then you can see a detail view by instances:

The “#” is the process identifier (PID) in Task Manager.
Active Users
Then you have a detail of the Active users:

Message Log
Finally, you can see the message logs for all instances:

Server
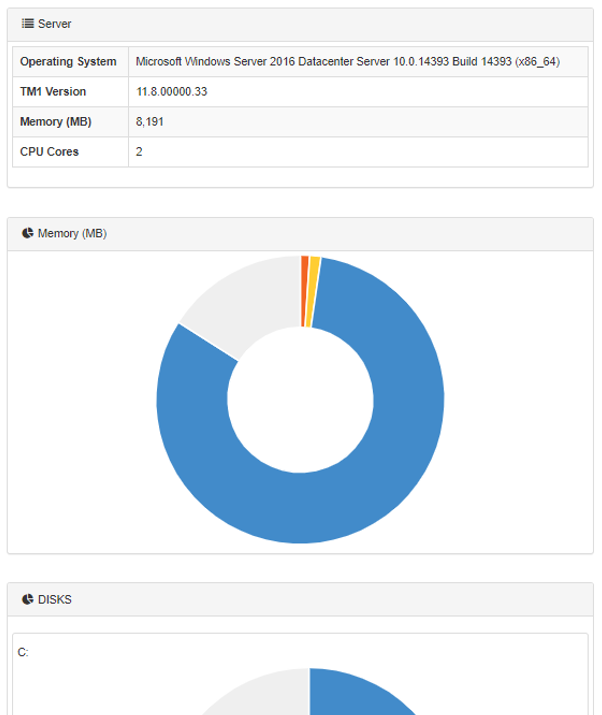
The last section is about the server where TM1 is installed, OS and TM1 version, memory, CPU, and the disk space (This information is not available if you are using Planning Analytics Cloud).

Troubleshooting
Next:
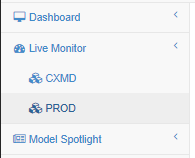
To get more information about one instance, you can click on one instance name or choose the instance name under Live Monitor form the left menu pane.

